The installation first generated on 2 December 2011 and readings from the generation meter are used to update the various charts and tables each month.
A more accurate figure can be obtained by using the calculator made available by the Photovoltaic Geographical Information System (PVGIS) (2). This showed a predicted annual output of 3140kWh at the time of installation but revised data now indicates 3210kWh. A third calculation, using the PVSOL calculator, indicates an output of 3050kWh.
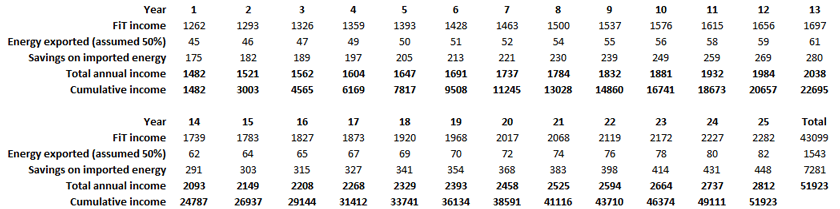
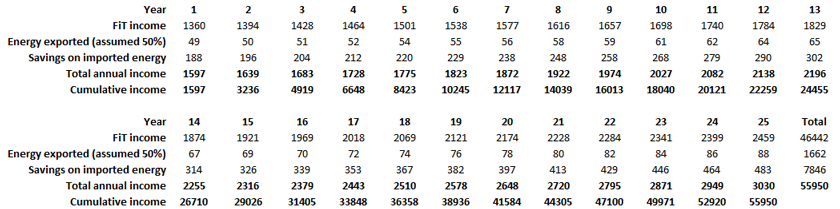
* The above tables assume initial FiT and export rates of 43.3p and 3.1p increasing at 2.5% per annum, imported energy prices increasing at 4% per annum on a base 12p per kWh.
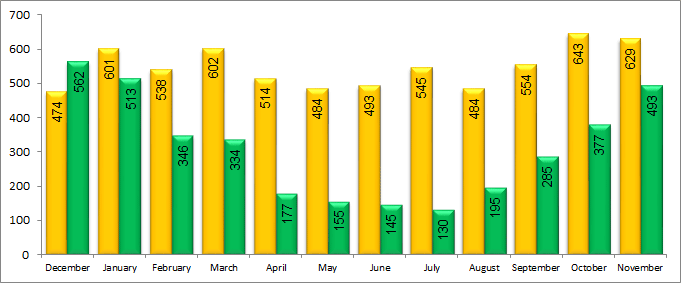
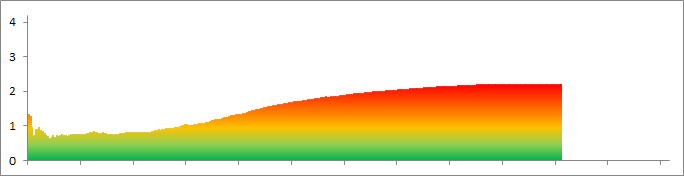
Electricity consumption from the grid pre PV installation v post PV installation: running average (kWh)
Interpretation of data presented in this chart is more difficult than that for others as consumption can vary quite widely year-on-year as a consequence of changes in such variables as occupancy patterns and the presence of electrical appliances. Never-the-less, the data presented is real data from a real installation.
The graph displays cumulative income calculated on the Feed in Tariff and an additional amount for the 50% of generated energy which is deemed to be exported. At the time the system was commissioned, the Feed in Tariff was 43.3p per kWh and the Export Tariff was 3.1p per kWh. Both are increased each April by an amount which reflects the increase in the Retail Price Index over the previous 12 months. Savings made from reductions in imported energy are not included.
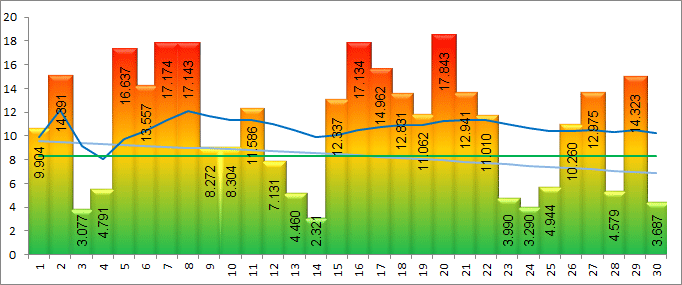
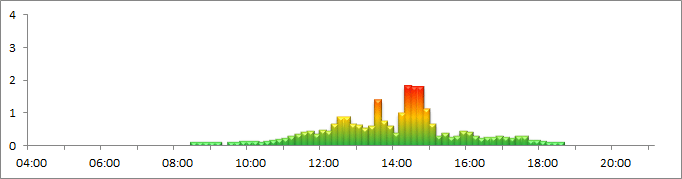
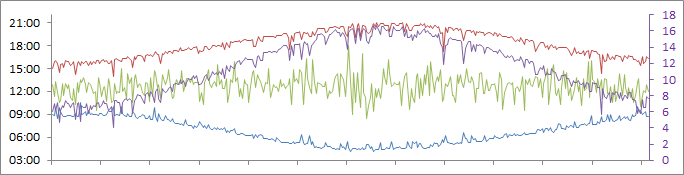
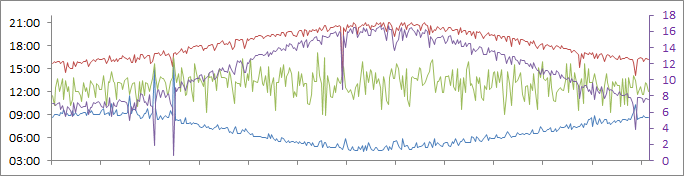
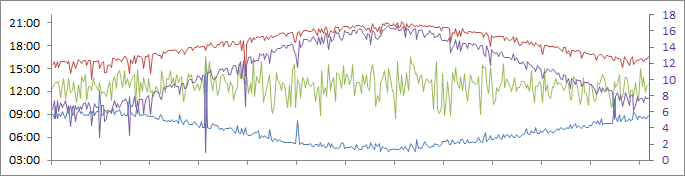
Daily generation start, peak and stop times, and generation period, Year 10, 2020-21
Daily maximum, minimum*, intra-day peak** and average generation (kWh), with monthly totals (kWh) and variation (%)
* Several minima of zero when the panels were entirely covered in snow have been ignored
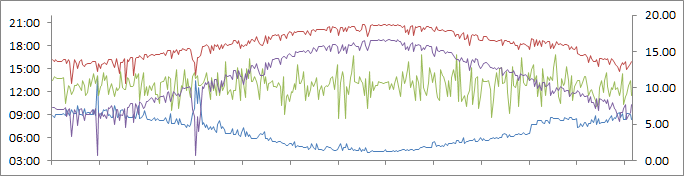
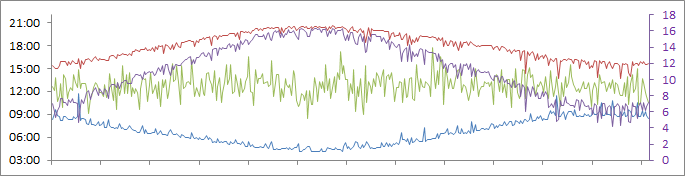
** Output is recorded by the system every 10 minutes and so transient highs are missed. Readings in excess of 4kW have been regularly observed. All times are GMT.
July
28.034 on 2 July
4.825 on 11 July
3.720 at 13:40 on 1 July
16.307
505.514
+25.0%
June
27.280 on 18 June
2.775 on 23 June
3.618 at 13:40 on 7 June
13.860
415.785
+3.4%
May
26.781 on 26 May
2.113 on 29 May
3.726 at 14:20 on 27 May
16.050
497.549
+19.1%
April
24.109 on 23 April
5.876 on 14 April
3.786 at 13:50 on 15 April
13.781
413.427
+22.7%
March
19.670 on 24 March
1.923 on 22 March
3.270 at 13:30 on 31 March
9.942
303.129
+23.0%
February
9.690 on 24 February
0.035 on 13 February
2.526 at 12:20 on 24 February
3.709
103.842
-13.3%
January
8.200 on 25 January
0.332 on 6 January
1.704 at 13:30 on 25 January
2.365
73.330
-0.5%
2016
December
4.950 on 29 December
0.260 on 23 December
1.440 at 13:40 on 4 December
2.094
64.902
+4.8%
November
7.233 on 2 November
0.175 on 9 November
1.956 at 12:00 on 4 November
3.392
101.773
+14.6%
October
14.909 on 3 October
1.835 on 30 October
3.024 at 12:40 on 2 October
6.304
195.429
+20.4%
September
17.739 on 11 September
3.330 on 3 September
3.084 at 12:30 on 11 September
10.628
318.829
+25.5%
August
21.795 on 16 August
3.071 on 25 August
3.570 at 15:10 on 4 August
14.050
435.548
+28.9%
July
24.821 on 3 July
6.390 on 9 July
3.768 at 13:20 on 30 July
16.205
502.352
+24.2%
June
26.274 on 6 June
5.395 on 1 June
3.708 at 13:40 on 25 June
14.505
435.137
+8.2%
May
26.704 on 16 May
5.281 on 25 May
3.648 at 13:40 on 3 May
16.404
508.520
+21.7%
April
24.227 on 20 April
2.491 on 12 April
3.756 at 12:50 on 30 April
13.191
395.732
+17.5%
March
18.729 on 31 March
0.042 on 4 March
3.414 at 13:00 on 31 March
7.626
255.669
+3.7%
February
12.344 on 23 February
0.823 on 6 February
2.688 at 13:50 on 23 February
5.989
167.043
+40.1%
January
6.066 on 15 January
0.050 on 17 January
1.674 at 13:40 on 29 January
1.987
61.582
-16.5%
2015
December
4.811 on 29 December
0.087 on 12 December
1.404 at 12:10 on 29 December
1.573
48.766
-21.2%
November
7.895 on 1 November
0.286 on 30 November
1.980 at 12:50 on 16 November
2.453
73.596
-17.1%
October
15.595 on 1 October
0.800 on 28 October
2.688 at 13:30 on 6 October
6.111
189.433
+16.7%
September
21.110 on 6 September
4.053 on 8 September
3.600 at 13:20 on 4 September
11.437
343.108
+35.0%
August
20.879 on 27 August
2.511 on 14 August
3.546 at 13:50 on 15 August
13.356
414.037
+22.5%
July
27.213 on 15 July
8.135 on 27 July
3.636 at 13:00 on 19 July
16.036
497.103
+22.9%
June
28.448 on 10 June
5.696 on 14 June
3.846 at 14:10 on 21 June
18.433
552.994
+37.5%
May
24.711 on 26 May
7.867 on 2 May
3.894 at 14:00 on 19 May
15.936
494.005
+18.2%
April
24.105 on 21 April
3.745 on 3 April
3.798 at 13:00 on 11 April
16.671
500.129
+48.5%
March
17.068 on 31 March
2.188 on 9 March
3.180 at 13:40 on 31 March
9.274
297.817
+20.8%
February
11.670 on 23 February
0.665 on 13 February
2.814 at 14:10 on 27 February
5.494
153.843
+28.5%
January
7.522 on 30 January
0.000 on 21 January

1.920 at 12:20 on 31 January
2.574
79.800
+8.2%
2014
December
5.532 on 3 December
0.313 on 21 December
1.500 at 12:40 on 13 December
2.594
80.404
+29.9%
November
10.093 on 3 November
0.332 on 27 November
2.058 at 13:10 on 4 November
2.785
83.548
-5.9%
October
13.153 on 2 October
0.798 on 27 October
2.730 at 13:40 on 4 October
5.682
176.143
+8.5%
September
19.783 on 7 September
2.520 on 19 September
3.066 at 11:40 on 2 September
9.658
289.753
+14.0%
August
24.811 on 4 August
5.424 on 25 August
3.588 at 13:40 on 14 August
14.455
448.092
+32.6%
July
26.938 on 9 July
7.033 on 19 July
3.738 at 12:20 on 13 July
18.236
565.325
+39.8%
June
25.940 on 12 June
5.270 on 27 June
3.576 at 12:30 on 12 June
15.257
457.723
+13.8%
May
26.509 on 17 May
2.018 on 1 May
3.888 at 13:50 on 13 May
14.129
438.000
+4.8%
April
24.056 on 18 April
2.311 on 3 April
3.480 at 12:40 on 14 April
11.688
350.647
+4.1%
March
19.420 on 24 March
2.491 on 25 March
3.156 at 12:50 on 24 March
9.761
302.581
+22.7%
February
11.095 on 27 February
0.675 on 5 February
2.958 at 13:30 on 25 February
5.445
152.447
+27.3%
January
6.225 on 20 January
0.155 on 1 January
2.154 at 13:10 on 23 January
2.555
79.211
+7.4%
2013
December
4.509 on 29 December
0.175 on 23 December
1.554 at 13:10 on 4 December
2.076
64.359
+4.0%
November
10.319 on 4 November
1.296 on 11 November
2.046 at 14:30 on 5 November
4.387
131.611
+48.2%
October
12.662 on 6 October
0.280 on 12 October
3.558 at 14:50 on 10 October
5.455
169.109
+4.1%
September
16.857 on 22 September
2.759 on 6 September
3.450 at 14:00 on 9 September
9.482
284.471
+12.0%
August
22.105 on 18 August
4.711 on 24 August
3.564 at 13:40 on 31 August
14.509
449.785
+33.1%
July
26.068 on 5 July
7.215 on 2 July
3.690 at 14:10 on 3 July
18.363
569.240
+40.8%
June
27.694 on 7 June
8.170 on 11 June
3.600 at 14:10 on 2 June
17.790
533.702
+32.7%
May
27.890 on 25 May
3.661 on 18 May
3.810 at 11:50 on 16 May
14.914
462.341
+10.6%
April
23.378 on 20 April
5.114 on 11 April
3.882 at 12:30 on 26 April
13.653
409.588
+21.6%
March
16.549 on 29 March
0.428 on 8 March
3.624 at 13:40 on 30 March
7.067
219.091
-11.1%
February
13.841 on 28 February
0.651 on 13 February
2.370 at 11:50 on 27 February
5.183
145.130
+15.0%
January
6.749 on 27 January
0.009 on 14 January
1.836 at 12:50 on 27 January
1.386
42.979
-41.7%
2012
December
6.166 on 2 December
0.042 on 14 December
1.632 at 12:30 on 5 December
2.231
69.149
+11.7%
November
7.846 on 5 November
0.548 on 20 November
2.148 at 12:10 on 2 November
3.617
108.502
+22.2%
October
13.626 on 7 October
0.645 on 24 October
2.922 at 12:20 on 5 October
6.446
199.813
+23.1%
September
18.738 on 8 September
1.329 on 24 September
3.240 at 13:20 on 2 September
11.124
333.716
+31.3%
August
22.868 on 8 August
4.611 on 27 August
3.666 at 13:00 on 3 August
12.319
381.902
+13.0%
July
26.849 on 11 July
1.944 on 6 July
3.750 at 13:10 on 12 July
13.846
429.231
+6.1%
June
23.15 on 26 June
4.298 on 21 June
3.852 at 15:40 on 25 June
12.512
375.352
-6.7%
May
27.875 on 18 May
3.736 on 10 May
3.978 at 14:50 on 16 May
17.147
531.545
+27.2%
April
22.855 on 10 April
1.867 on 1 April
3.738 at 15:00 on 21 April
11.142
334.262
-0.8%
March
18.361 on 26 March
1.731 on 4 March
2.814 at 16:00 on 30 March
10.772
333.941
+35.5%
February
12.25 on 19 February
0.087 on 5 February
2.172 at 12:30 on 15 February
4.090
118.614
-4.3%
January
6.968 on 28 January
0.403 on 1 January
1.782 at 13:50 on 26 January
2.877
89.190
+21.0%
2011
December
5.037 on 18 December
0.281 on 23 December
1.572 at 12:20 on 24 December
1.656
57.375
-17.1%
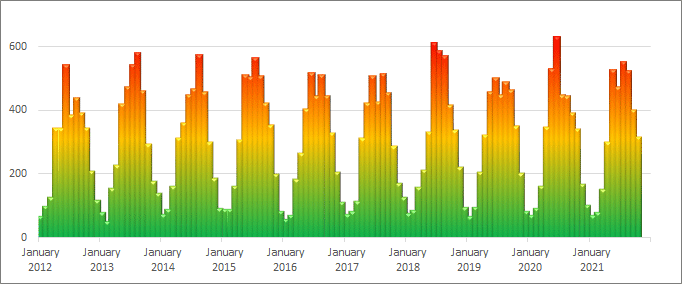
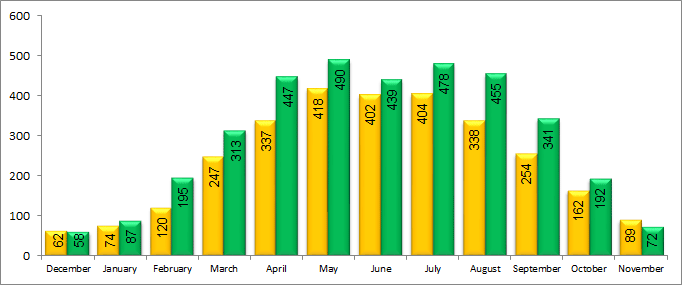
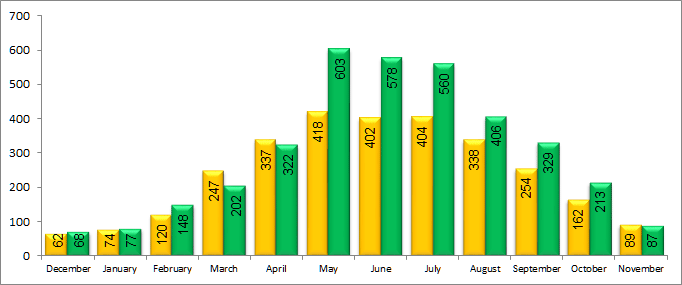
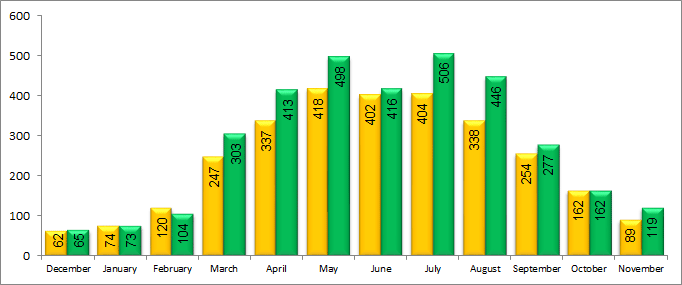
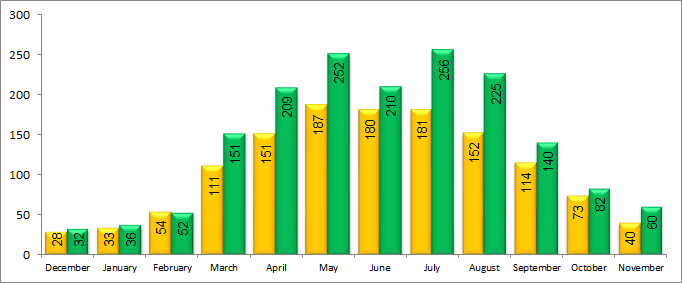
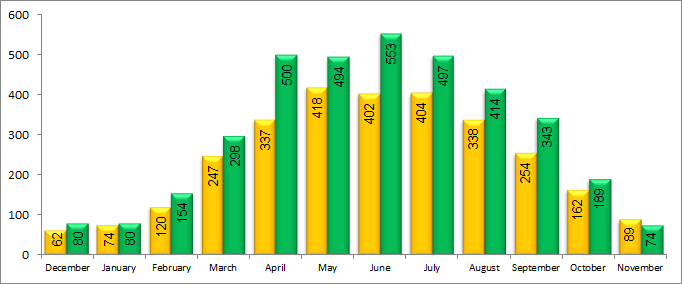
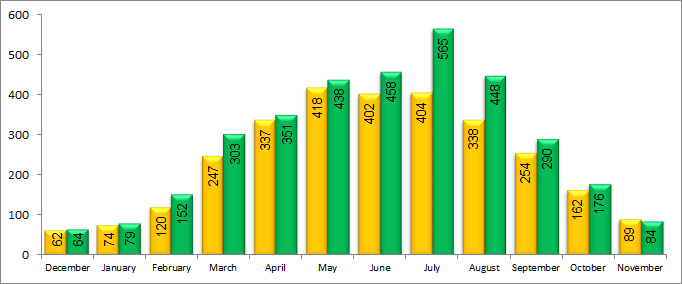
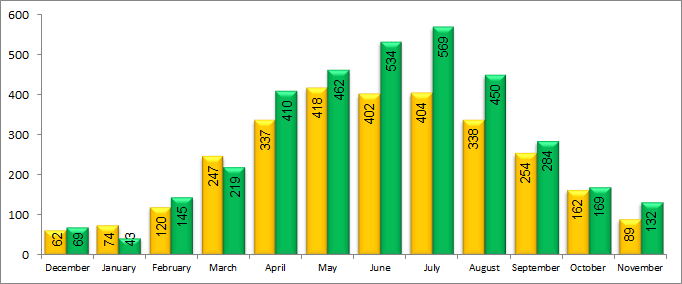
Historic monthly generation totals
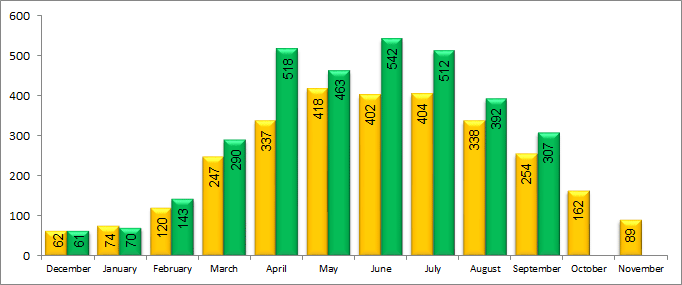
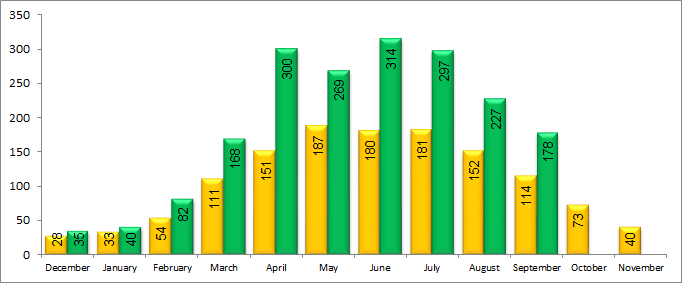
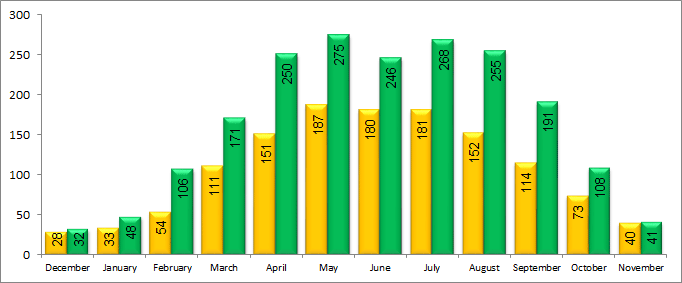
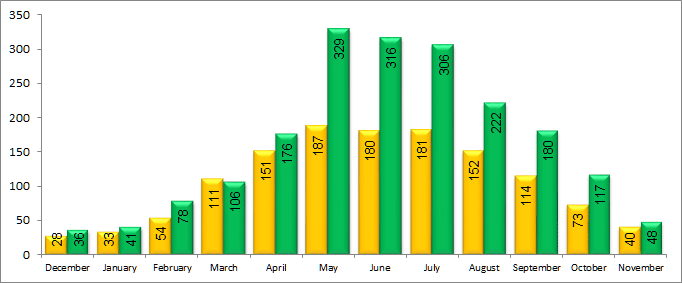
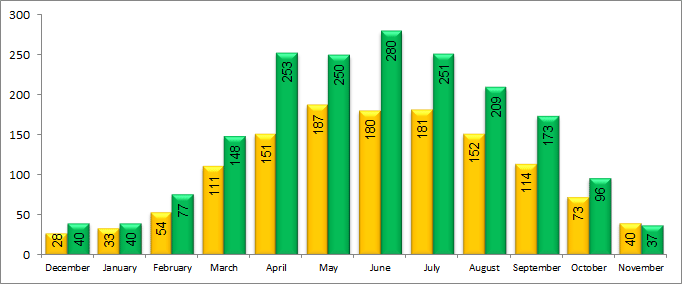
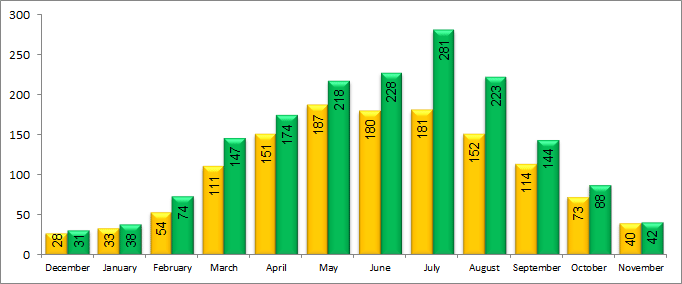
Historic daily generation totals
Year 9 (2019-20) Summary
Generation (kWh)
Calculation
Predicted
Actual
Variation
% Variation
PVGIS
3206.471
3601.028
+394.557
+12.3%
SAP
2910.796
3601.028
+690.232
+23.7%
Income
Calculation
Predicted
Actual
Variation
% Variation
PVGIS
£1438.10
£2083.58
+£645.48
+44.9%
SAP
£1305.49
£2083.58
+£778.09
+59.6%
Total import savings (Year 9)
£232
29.43%
Return on capital at end of Year 9
+21.8% (excluding import savings)
+25.5% (including import savings)
Predicted output v 2019-20 actual output
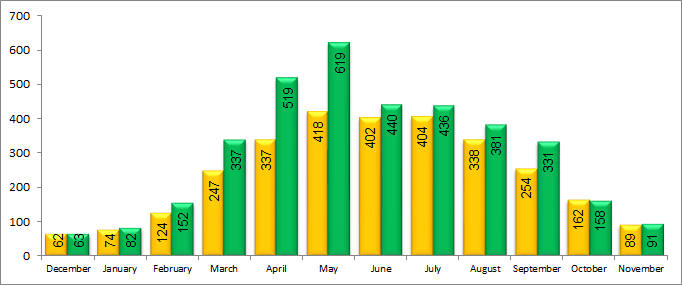

Predicted output (kWh)

Actual output (kWh)
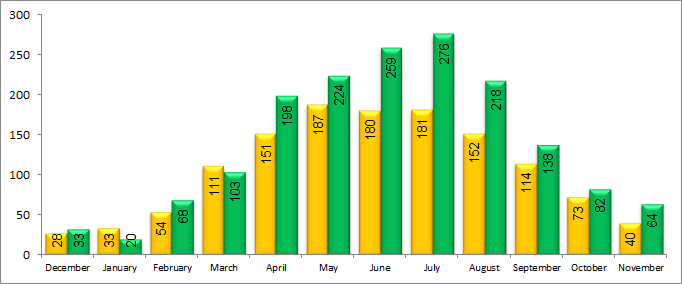
Predicted Feed in Tariff income v 2019-20 actual
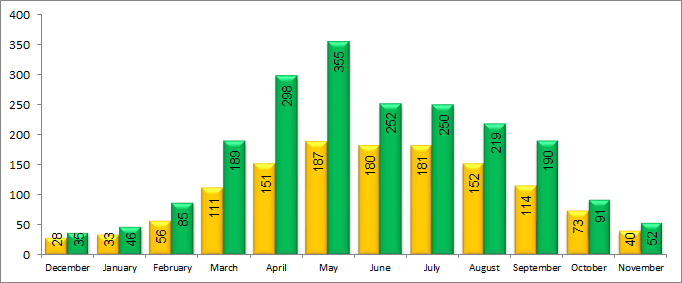
Predicted FiT income (£)
Actual FiT income (£)
Cumulative return on investment 2019-20 (£)
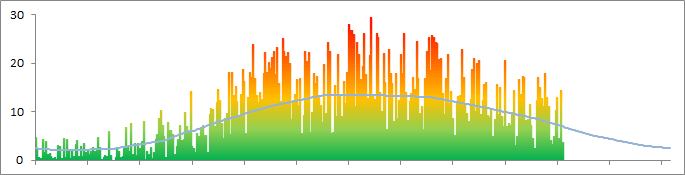
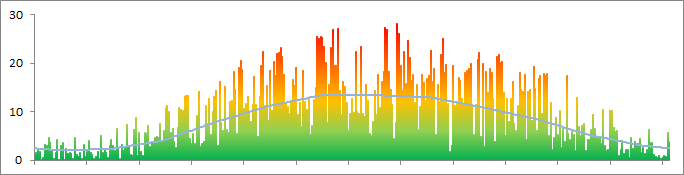
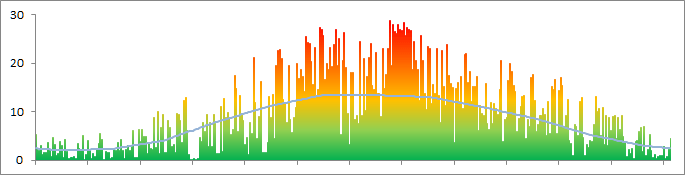
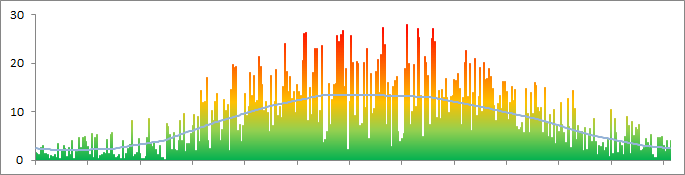
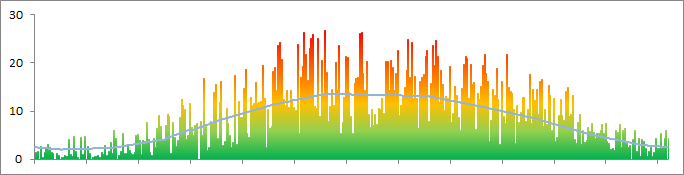
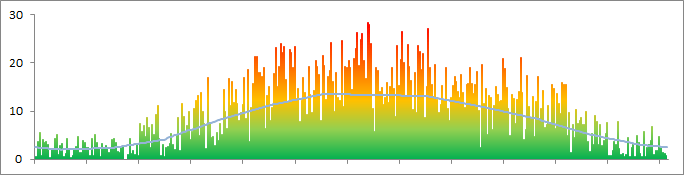
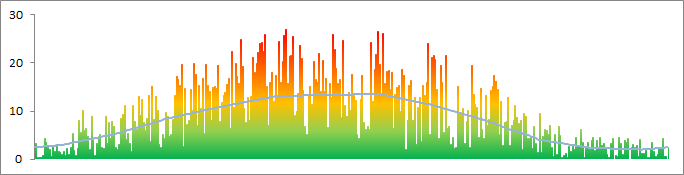
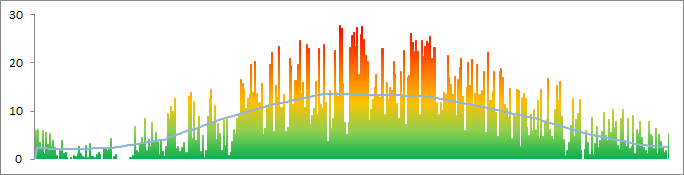
Daily generation (kWh) 2019-20
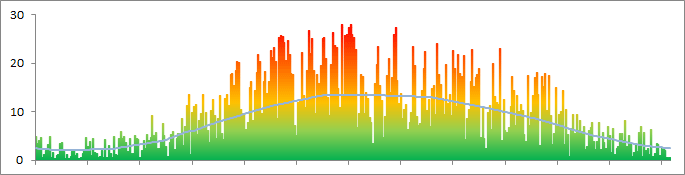

Actual daily generation (kWh)

Predicted rolling average (kWh)
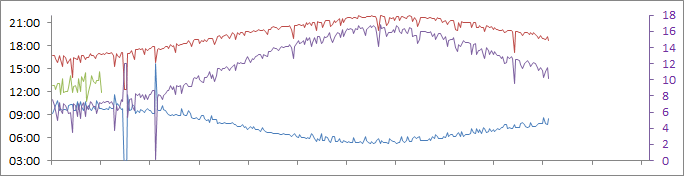
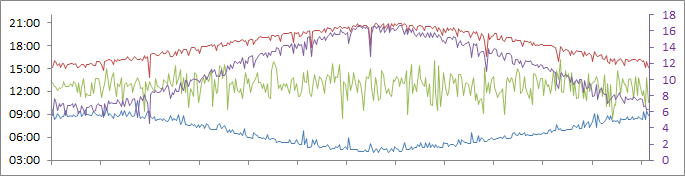
Daily generation start, peak and stop times, and generation period, 2019-20
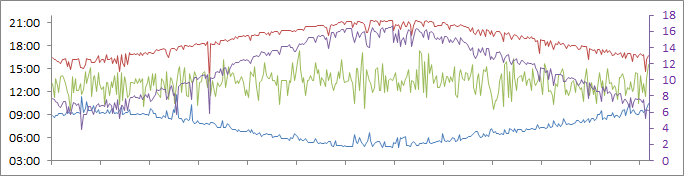

Daily generation start time, Year 9 (time: left hand axis)

Daily generation peak time, Year 9 (time: left hand axis)

Daily generation stop time, Year 9 (time: left hand axis)

Daily generation period, Year 9 (hours: right hand axis)
[All times are GMT]
Year 8 (2018-19) Summary
Generation (kWh)
Calculation
Predicted
Actual
Variation
% Variation
PVGIS
3201.760
3311.710
+109.950
+3.4%
SAP
2906.520
3311.710
+405.190
+13.9%
Income
Calculation
Predicted
Actual
Variation
% Variation
PVGIS
£1435.99
£1991.18
+£555.20
+38.7%
SAP
£1303.57
£1991.18
+£687.60
+52.7%
Total import savings (Year 8)
£277
35.19%
Return on capital at end of Year 8
+18.7% (excluding import savings)
+22.8% (including import savings)
Predicted output v 2018-19 actual output
Predicted output (kWh)
Actual output (kWh)
Predicted Feed in Tariff income v 2018-19 actual
Predicted FiT income (£)
Actual FiT income (£)
Cumulative return on investment 2018-19 (£)
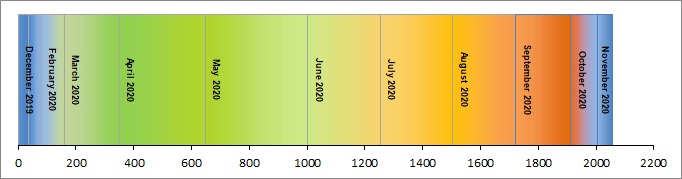
Daily generation (kWh) 2018-19
Actual daily generation (kWh)
Predicted rolling average (kWh)
Daily generation start, peak and stop times, and generation period, 2018-19
Daily generation start time, Year 8 (time: left hand axis)
Daily generation peak time, Year 8 (time: left hand axis)
Daily generation stop time, Year 8 (time: left hand axis)
Daily generation period, Year 8 (hours: right hand axis)
[All times are GMT]
Year 7 (2017-18) Summary
Generation (kWh)
Calculation
Predicted
Actual
Variation
% Variation
PVGIS
3201.760
3595.211
+393.451
+12.29%
SAP
2906.520
3595.211
+688.691
+23.69%
Income
Calculation
Predicted
Actual
Variation
% Variation
PVGIS
£1435.99
£1952.65
+£516.66
+35.98%
SAP
£1303.57
£1952.65
+£649.07
+49.79%
Total import savings (Year 7)
£377
47.9%
Return on capital at end of Year 7
+18.7% (excluding import savings)
+22.8% (including import savings)
Predicted output v 2017-18 actual output
Predicted output (kWh)
Actual output (kWh)
Predicted Feed in Tariff income v 2017-18 actual
Predicted FiT income (£)
Actual FiT income (£)
Cumulative return on investment 2017-18 (£)
Daily generation (kWh) 2017-18
Actual daily generation (kWh)
Predicted rolling average (kWh)
Daily generation start, peak and stop times, and generation period, 2017-18
Daily generation start time, Year 7 (time: left hand axis)
Daily generation peak time, Year 7 (time: left hand axis)
Daily generation stop time, Year 7 (time: left hand axis)
Daily generation period, Year 7 (hours: right hand axis)
[All times are GMT]
Year 6 (2016-17) Summary
Generation (kWh)
Calculation
Predicted
Actual
Variation
% Variation
PVGIS
3201.760
3380.916
+179.156
+5.59%
SAP
2906.520
3380.916
+474.396
+16.32%
Income
Calculation
Predicted
Actual
Variation
% Variation
PVGIS
£1435.99
£1705.06
+£269.07
+18.74%
SAP
£1303.57
£1705.06
+£401.48
+30.8%
Total import savings (Year 6)
£368
46.8%
Return on capital at end of Year 6
+21.4% (excluding import savings)
+25.5% (including import savings)
Predicted output v 2016-17 actual output
Predicted output (kWh)
Actual output (kWh)
Predicted Feed in Tariff income v 2016-17 actual
Predicted FiT income (£)
Actual FiT income (£)
Cumulative return on investment 2016-17 (£)
Daily generation (kWh) 2016-17
Actual daily generation (kWh)
Predicted rolling average (kWh)
Daily generation start, peak and stop times, and generation period, 2016-17
Daily generation start time, Year 6 (time: left hand axis)
Daily generation peak time, Year 6 (time: left hand axis)
Daily generation stop time, Year 6 (time: left hand axis)
Daily generation period, Year 6 (hours: right hand axis)
[All times are GMT]
Year 5 (2015-16) Summary
Generation (kWh)
Calculation
Predicted
Actual
Variation
% Variation
PVGIS
3206.471
3426.380
+219.909
+6.85%
SAP
2906.520
3426.380
+519.86
+17.89%
Income
Calculation
Predicted
Actual
Variation
% Variation
PVGIS
£1438.10
£1728.14
+£290.04
+20.2%
SAP
£1305.49
£1728.14
+£422.65
+32.4%
Total import savings (Year 5)
£310
39.41%
Return on capital at end of Year 5
+18.1% (excluding import savings)
+22.2% (including import savings)
Predicted output v 2015-16 actual output
Predicted output (kWh)
Actual output (kWh)
Predicted Feed in Tariff income v 2015-16 actual
Predicted FiT income (£)
Actual FiT income (£)
Cumulative return on investment 2015-16 (£)
Daily generation (kWh) 2015-16
Actual daily generation (kWh)
Predicted rolling average (kWh)
Daily generation start, peak and stop times, and generation period, 2015-16
Daily generation start time, Year 5 (time: left hand axis)
Daily generation peak time, Year 5 (time: left hand axis)
Daily generation stop time, Year 5 (time: left hand axis)
Daily generation period, Year 5 (hours: right hand axis)
[All times are GMT]
Year 4 (2014-15) Summary
Generation (kWh)
Calculation
Predicted
Actual
Variation
% Variation
PVGIS
3201.760
3676.269
+474.509
+14.8%
SAP
2906.520
3676.269
+769.749
+26.5%
Income
Calculation
Predicted
Actual
Variation
% Variation
PVGIS
£1435.99
£1853.86
+£417.87
+22.5%
SAP
£1303.57
£1853.86
+£550.28
+29.7%
Total import savings (Year 4)
£415
52.76%
Return on capital at end of Year 4
+18.3% (excluding import savings)
+22.5% (including import savings)
Predicted output v 2014-15 actual output
Predicted output (kWh)
Actual output (kWh)
Predicted Feed in Tariff income v 2014-15 actual
Predicted FiT income (£)
Actual FiT income (£)
Cumulative return on investment 2014-15 (£)
Daily generation (kWh) 2014-15
Actual daily generation (kWh)
Predicted rolling average (kWh)
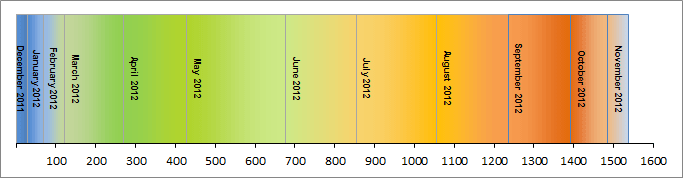
Daily generation start, peak and stop times, and generation period, 2014-15
Daily generation start time, Year 4 (time: left hand axis)
Daily generation peak time, Year 4 (time: left hand axis)
Daily generation stop time, Year 4 (time: left hand axis)
Daily generation period, Year 4 (hours: right hand axis)
[All times are GMT]
Year 3 (2013-14) Summary
Generation (kWh)
Calculation
Predicted
Actual
Variation
% Variation
PVGIS
3201.760
3407.829
+206.069
+6.4%
SAP
2906.520
3407.829
+501.309
+17.2%
Income
Calculation
Predicted
Actual
Variation
% Variation
PVGIS
£1435.99
£1688.09
+£252.11
+14.9%
SAP
£1303.57
£1688.09
+£384.52
+22.8%
Total import savings (year 3)
£393
49.92%
Return on capital at end of year 3
+17.8% (excluding import savings)
+21.0% (including import savings)
Predicted output v 2013-14 actual output
Predicted output (kWh)
Actual output (kWh)
Predicted Feed in Tariff income v 2013-14 actual
Predicted FiT income (£)
Actual FiT income (£)
Cumulative return on investment 2013-14 (£)
Daily generation (kWh) 2013-14
Actual daily generation (kWh)
Predicted rolling average (kWh)
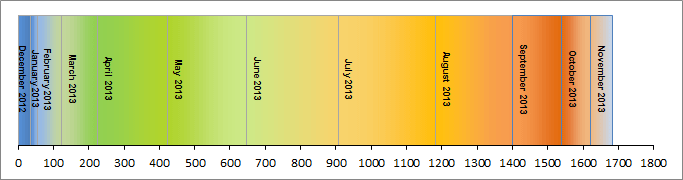
Daily generation start, peak and stop times, and generation period, 2013-14
Daily generation start time, year 3 (time: left hand axis)
Daily generation peak time, year 3 (time: left hand axis)
Daily generation stop time, year 3 (time: left hand axis)
Daily generation period, year 3 (hours: right hand axis)
[All times are GMT]
Year 2 (2012-13) Summary
Generation (kWh)
Calculation
Predicted
Actual
Variation
% Variation
PVGIS
3201.760
3486.196
+284.436
+8.9%
SAP
2906.520
3486.196
+579.676
+19.9%
Income
Calculation
Predicted
Actual
Variation
% Variation
PVGIS
£1435.99
£1682.46
+£246.47
+17.2%
SAP
£1303.57
£1682.46
+£378.89
+29.1%
Total import savings (year 2)
£389
49.36%
Return on capital at end of year 2
+17.4% (excluding import savings)
+21.6% (including import savings)
Predicted output v 2012-13 actual output
Predicted output (kWh)
Actual output (kWh)
Predicted Feed in Tariff income v 2012-13 actual
Predicted FiT income (£)
Actual FiT income (£)
Cumulative return on investment 2012-13 (£)
Daily generation (kWh) 2012-13
Actual daily generation (kWh)
Predicted rolling average (kWh)
Year 1 (2011-12) Summary
Generation (kWh)
Calculation
Predicted
Actual
Variation
% Variation
PVGIS
3206.470
3293.443
+86.973
+2.7%
SAP
2910.796
3293.443
+382.647
+13.1%
Income
Calculation
Predicted
Actual
Variation
% Variation
PVGIS
£1438.10
£1535.04
+£96.94
+6.7%
SAP
£1305.49
£1535.04
+£229.55
+17.6%
Total import savings (year 1)
£390
49.51%
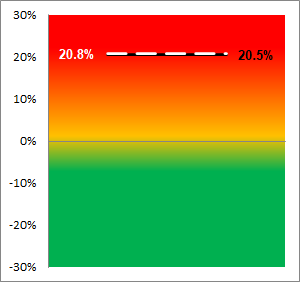
Return on capital at end of year 1
+16.6% (excluding import savings)
+20.8% (including import savings)
Predicted output v 2011-12 actual output
Predicted output (kWh)
Actual output (kWh)
Predicted Feed in Tariff income v 2011-12 actual
Predicted FiT income (£)
Actual FiT income (£)
Cumulative return on investment 2011-12 (£)
Daily generation (kWh) 2011-12
Actual daily generation (kWh)
Predicted rolling average (kWh)
© Frank Jukes 2011-17